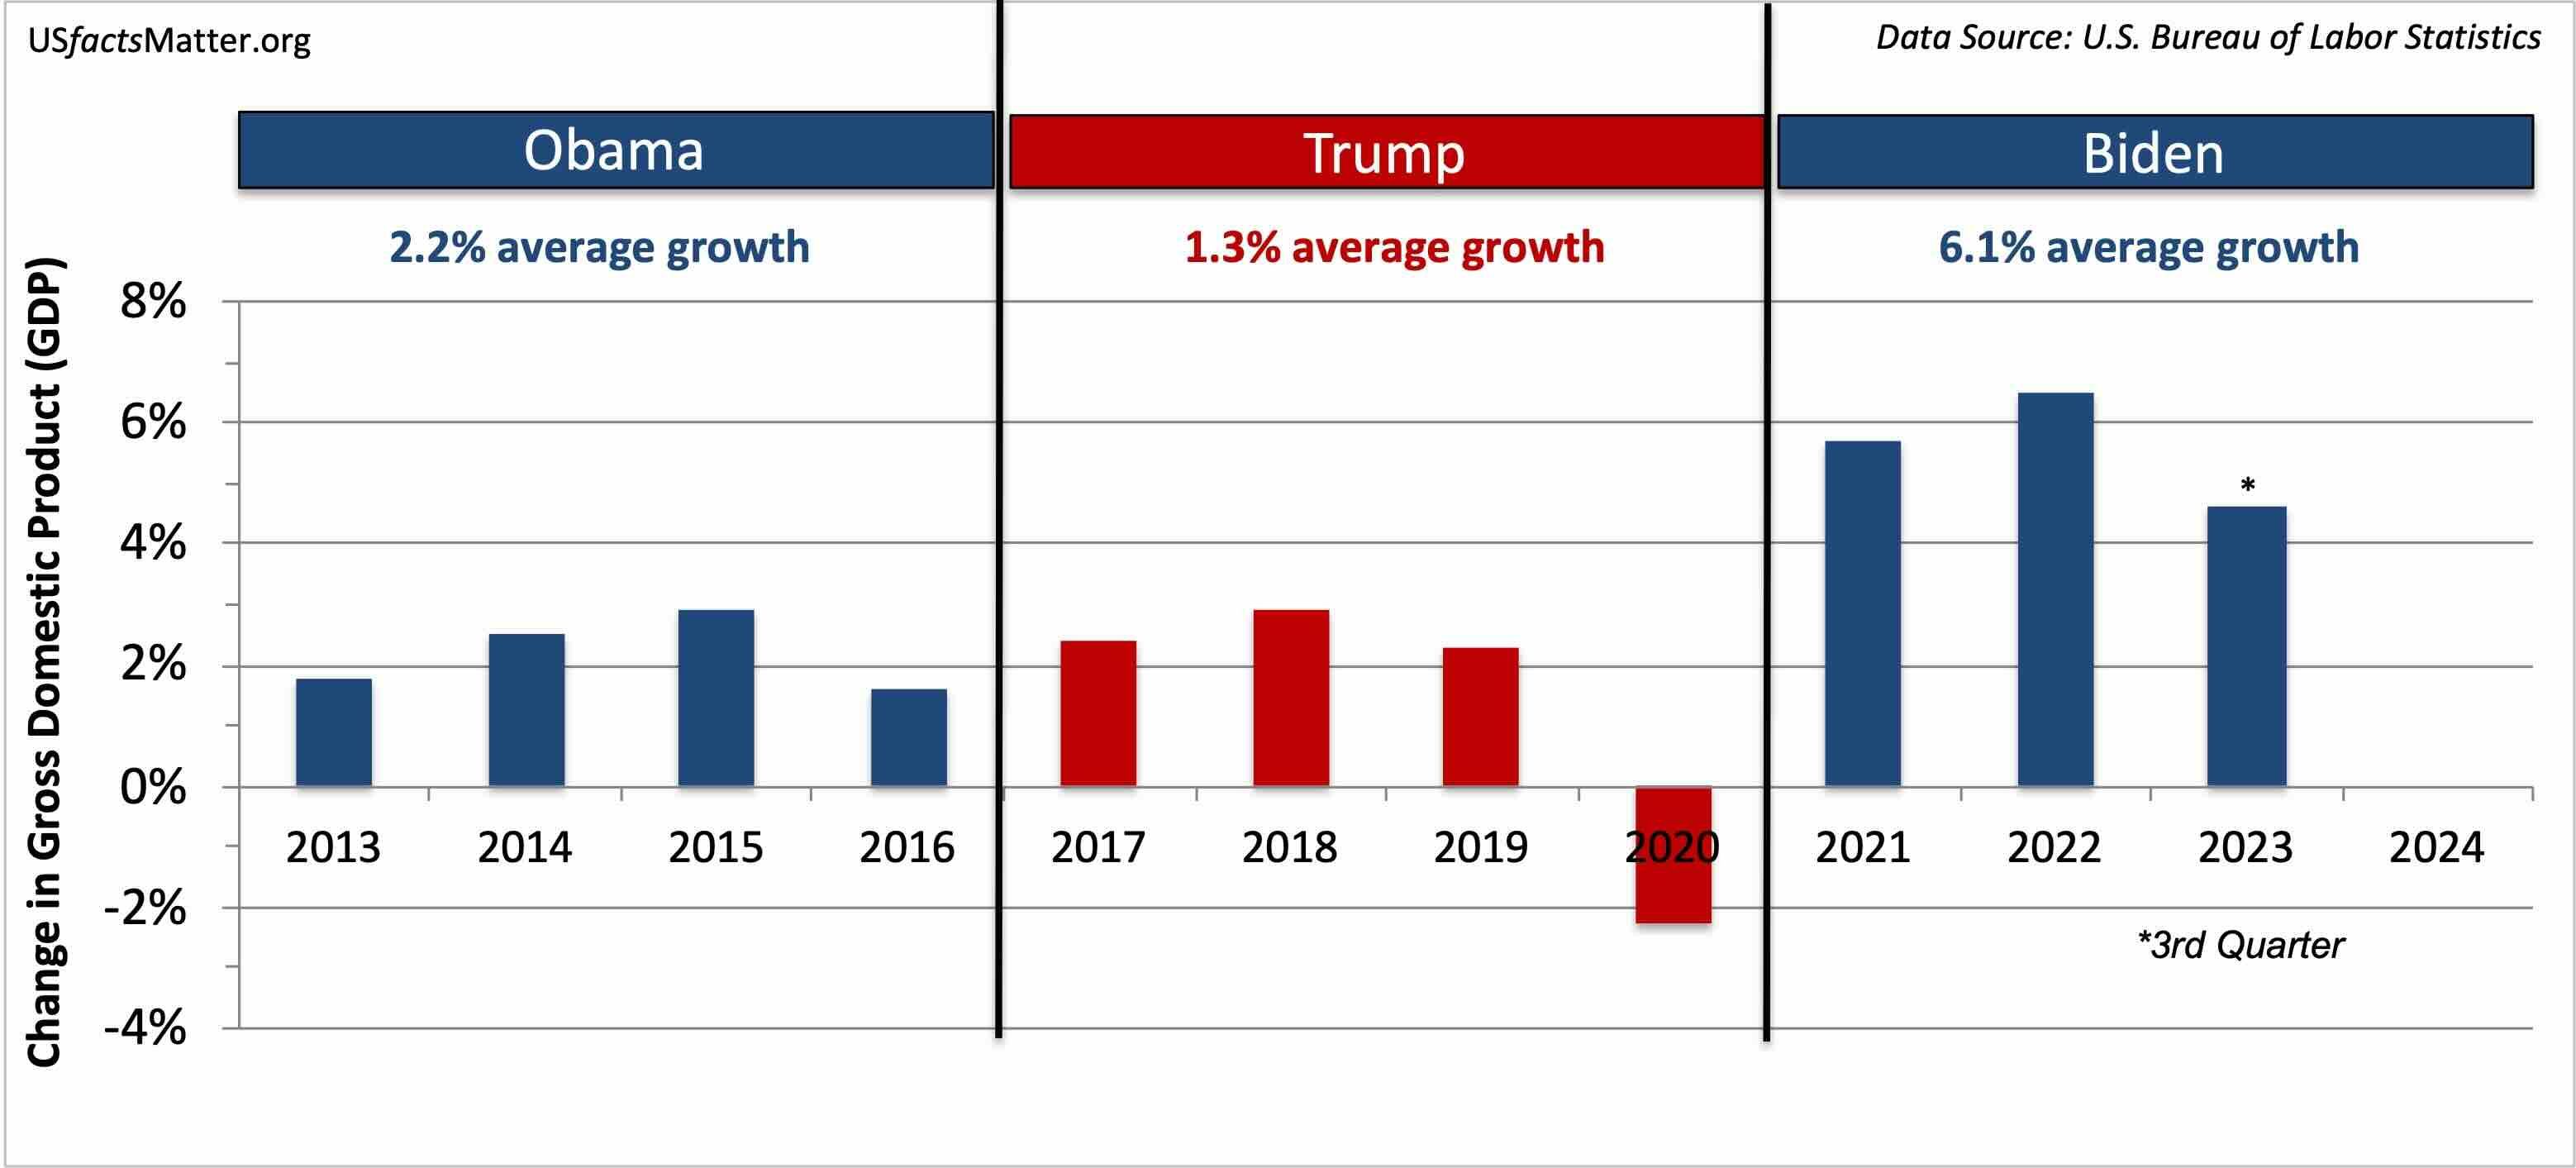
- The economy has grown by an annualized rate of 6.5% in real GDP in 2022, more than twice the average growth rate since 2000 (1.9%) and 4.6% in 2023 (as of the 3rd quarter)
- Economic growth under Biden is the highest in over 50 years.
- The economy shrank by 10.8% in the first half of 2020 after the introduction of COVID-19, wiping out all increases since 2017. This is the largest retraction of the economy on record (since 1875).
- The economy contracted by 2.3% overall in 2020, resulting in 1.3% average growth under Trump.
Has Trump helped the economy?

- 14.5 million jobs have been added under Biden in the first 3 years of his administration.
- This is 2.5 times growth rate during the best years under Trump, and over twice the average growth rate under Obama
- 128,000 fewer jobs per quarter were added to the US economy under Trump's first 3 years (2017-2019) than under Obama's last 3 years (2014-2016)
- Net Job Loss in 2020 was 9.4 million during the COVID-19 pandemic
- Job losses under Trump exceeded job gains during his entire administration (Net loss = 2.9 million)
Have jobs come back to America? Have jobs increased under Trump?

- The Unemployment rate is currently at its lowest level since 1969
- Unemployment is at 3.6% in 2023 under Biden, a drop of 2.4% since he took office.
- Unemployment rate in 2020 was 8.1%. It increased by 1.6% under Trump, compared to a decrease of 3.1% in unemployment under Obama.
- The Unemployment rate peaked at 14.7% in April of 2020, higher than at any time since the Great Depression
- Monthly Unemployment topped out at 10.8% under Reagan, and 10% under Obama
- Over the past 40 years, on average Unemployment has:
- In Democratic administrations — Improved by .48% per year
- In Republican administrations — Worsened by .28% per year
Has Trump improved employment? Who is better for employment? Do republicans improve unemployment? Did Obama have worse unemployment? Who is better for the economy?
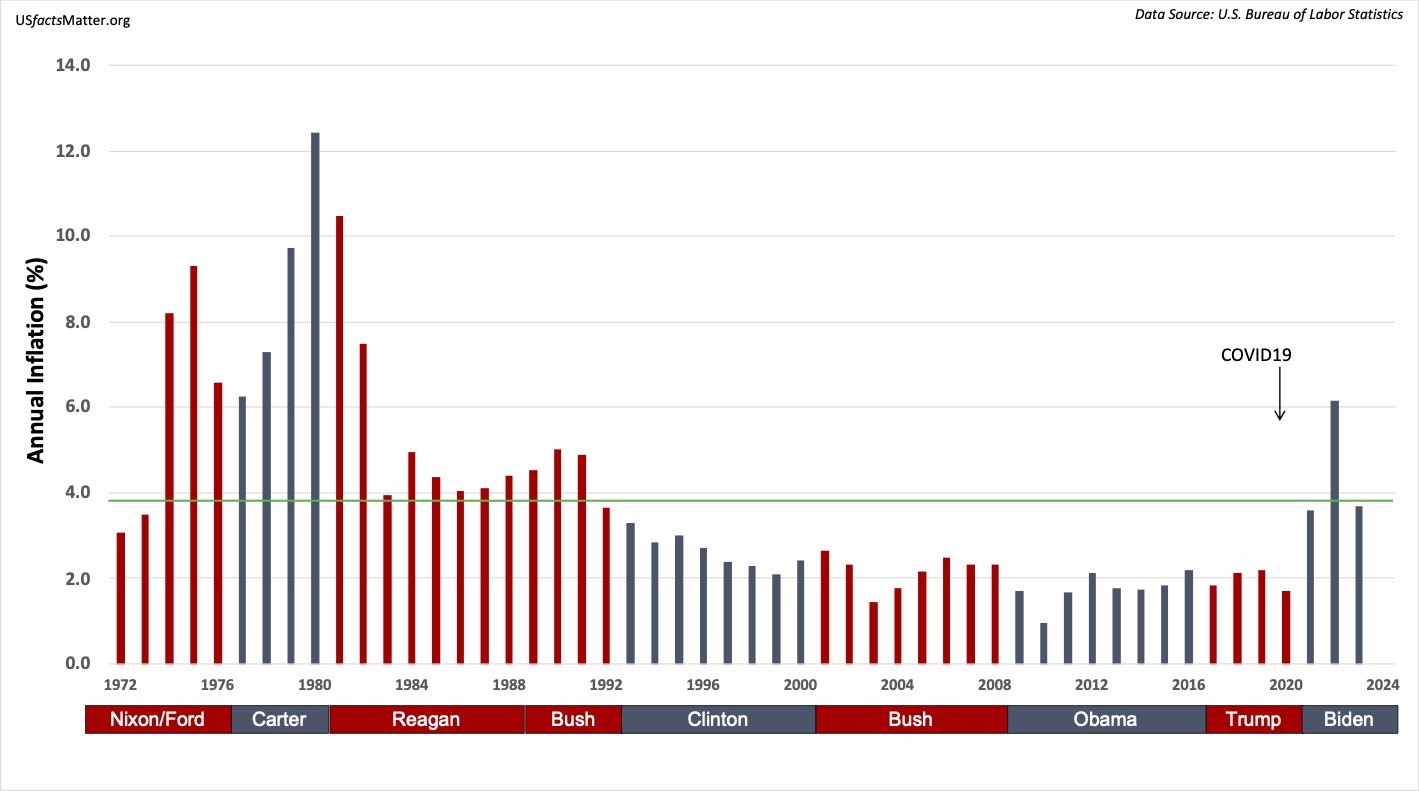
- Inflation is at 3.7% in 2023, just below the 50 average of 3.8%
- Inflation increased to 6.2% in 2022 due to a combination of COVID-19 related supply chain issues, labor shortages and increased energy costs following Russia's invasion of the Ukraine and subsequent embargo of Russian oil.
- 2022 Inflation was still less than average compared to the inflation rate of G-7 countries (7.8%) and all OECD countries (10.2%)
- Inflation was at historic lows throughout the past 20 years at round 2%.
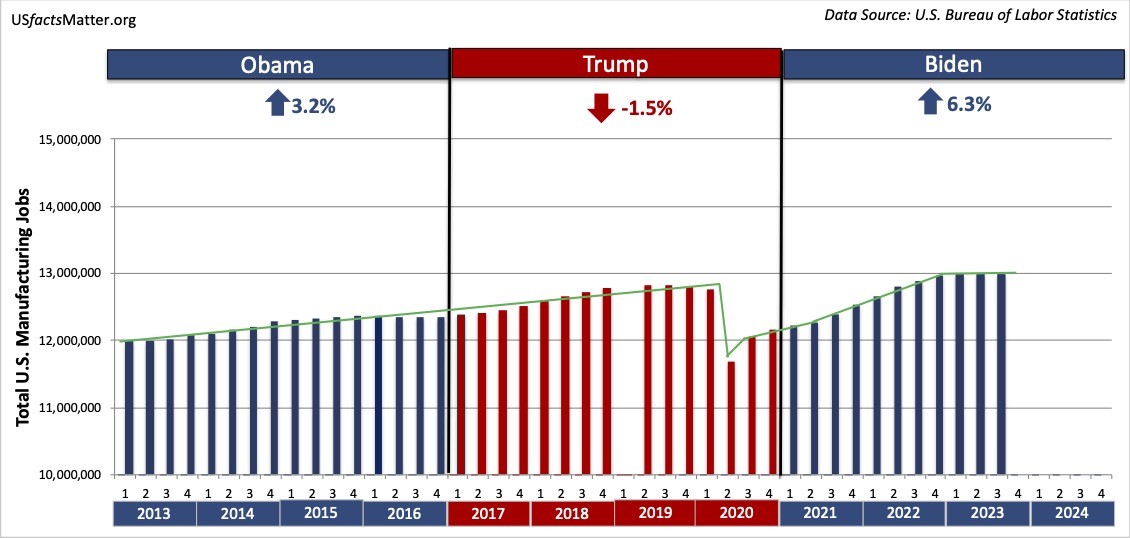
- Manufacturing jobs have increased by 6.3% under Biden, the largest increase in the past 40 years.
- Since the Great Recession, growth in manufacturing jobs has remained steady at about 1% per year, until 2020
- 154,000 Manufacturing jobs were lost during Trump's administration (-1.5%) primarily due to job losses in 2020 under CoVID-19
Has manufacturing grown under Trump? Has manufacturing come back?
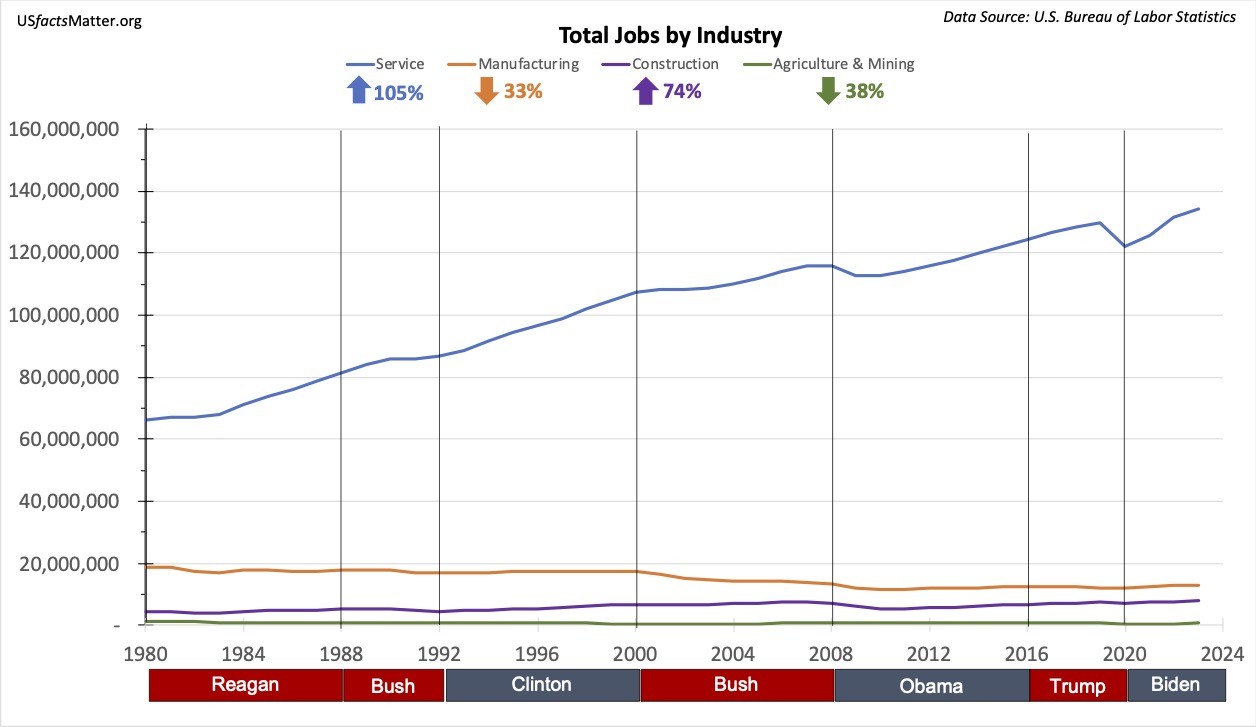
- Since 1980, Manufacturing jobs are down by 33%
- Manufacturing jobs have increased by 6.3% under Biden
- The largest decrease in manufacturing jobs occurred during the G.W. Bush administration (2001-2008)
- Regan - 3.1 %
- Bush - 7.0 %
- Clinton + 1.9 %
- G.W. Bush -26.6 %
- Obama - 1.6 %
- Trump - 1.5%
- Biden + 6.3 %
- In comparison, since 1980:
- Service industry jobs have more than doubled
- Construction jobs have increased by 74% since 1980
- Today, Manufacturing provides less than 9% of all jobs in the U.S., while 86% of all jobs are Service related.
How has manufacturing changed? What jobs are growing? What has happened to manufacturing? How have service jobs grown?How have jobs changed?
Has manufacturing grown under Trump? Has manufacturing come back?
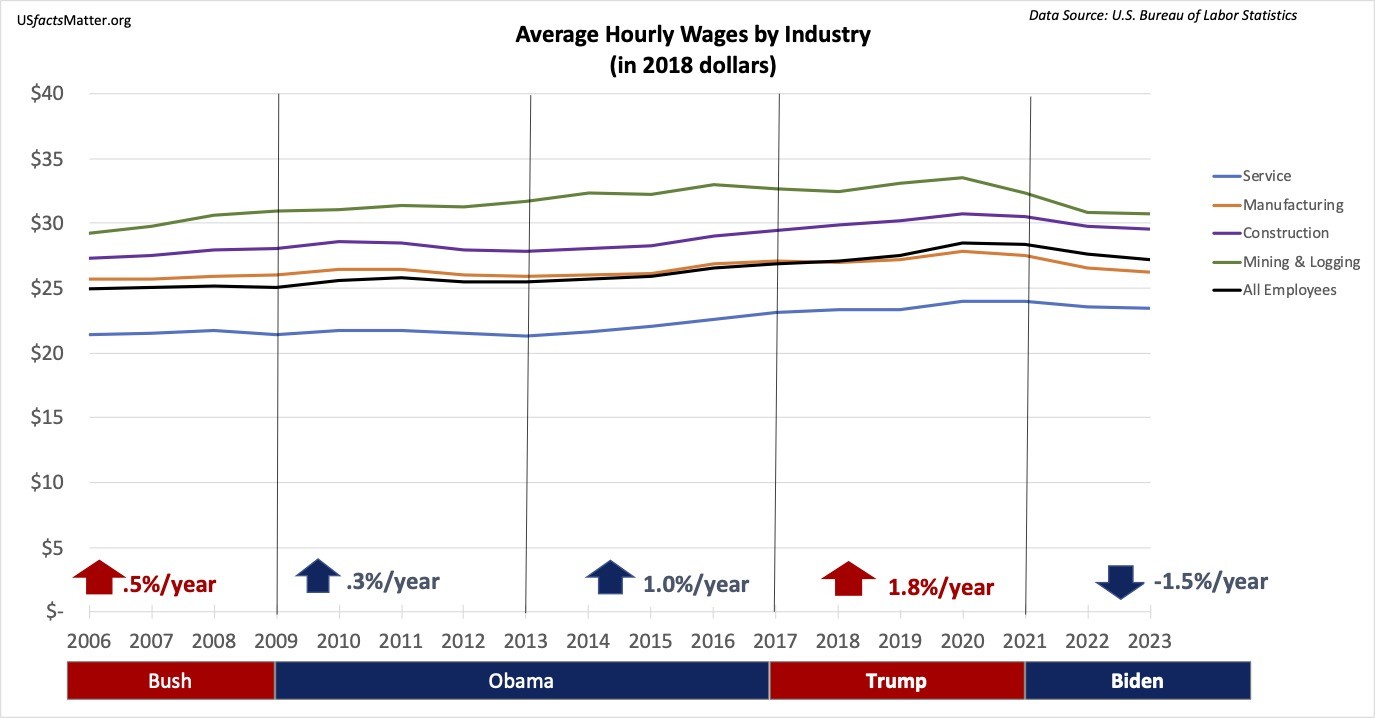
- Average weekly wages have increased by 23% under Biden ($34/hour compared to $27.58/hour).
- However inflation has eliminated those gains resulting in a net decrease of 1.5% in the last 3 years.
- Most of this loss was in 2021-2022 during the recovery from CoVid-19.
- In October 2023, the average wage for all workers was $34/hour
- Wages are highest for Mining and Logging workers ($38.42/hour),
- followed by Construction workers ($37.00/hour),
- Manufacturing workers ($32.79/hour), and
- Service workers ($28.79/hour)
- Since 2006 inflation adjusted wages have increased by 9%
- Average wages were relatively flat from 2006 to 2012 as the economy recovered from the great recession
- They have increased steadily since 2014, until inflation following COVID-19
How has manufacturing changed? What jobs are growing? What has happened to manufacturing? How have service jobs grown?How have jobs changed?
Has manufacturing grown under Trump? Has manufacturing come back?

- The US minimum wage is currently $7.25 per hour. It has not changed since 2009, although some state's have higher minimum wages.
- For a full time worker, this earns 76% of the minimum poverty level for a working parent with 1 child ($9.48/hour).
- It earns 50% of the minimum poverty level for a family of 4 ($14.42/hour).
- It earns 28% of what is needed for an average living wage for a family of 4 ($25.02/hour) which includes costs of housing, transportation, child care, education, healthcare and basic needs).
- Over 80 million workers are covered by minimum wage requirements
- Since 1980:
- The minimum wage peaked in 2009, and has steadily declined in inflaction adjusted dollars.
- It has been below the minimum poverty level for a working parent and 1 child 75% of the time, and has never provided enough earnings for a full time worker to support a family of 4.
- Some states have higher minimum wages
Some states have higher minimum wages
$7.25 - Most states
$8.00-11.00 - Alaska, Arkansas, Michigan, Minnesota, Montana, Nebraska, Nevada, Ohio, South Dakota, W. Virginia
$11.01-14.00 - Arizona, Colorado, Delaware, Florida, Hawaii, Illinois, Maine, Maryland, Missouri, New Mexico, Rhode Island, Vermont, Virginia
$14.01-17.00 - California, Connecticut, Massachusetts, New Jersey, New York, Oregon, District of Columbia, Washington
How has manufacturing changed? What jobs are growing? What has happened to manufacturing? How have service jobs grown?How have jobs changed?